andallthat.co.uk
  • Blog
  • GCSE / A Level Topics
    • America 1789-1900
    • Antisemitism
    • British Radicalism 1789-1900
    • Crusades
    • Elizabeth I
    • Germany 1919-45
    • Historical Interpretations
    • Historic Environment
    • International Relations 1900-2000
    • Italian Renaissance
    • Medicine
    • Medieval Kings
    • Russia 1855-1921
    • Soviet Russia
    • Politics Files
  • KS3 Topics
    • Interpretations
    • Stand-Alone Lessons
    • NEW KS3 File Store
    • OLD KS3 File Store
    • Student Resources
  • Advice
    • GCSE Options
    • A Level Options
    • Personal Studies
    • University Applications >
      • Choosing Courses
      • General Advice
      • Personal Statements
      • Predicted Grades
  • Teachers
    • YHEP Teach Meet
    • Stand-Alone Lessons >
      • Ancient World
      • Medieval World
      • Early Modern
      • Industrial Revolution
      • Modern World
      • Post-Modern World
    • KS3 Teaching Resources
  • MeetTheHistorians
  • Trips
  • About
    • SubBlog
  • Contact

What impact did non-specialist teaching have on grade stability?

8/29/2018

0 Comments

 
Back to main blog

5. What impact did non-specialist teaching have on grade stability?
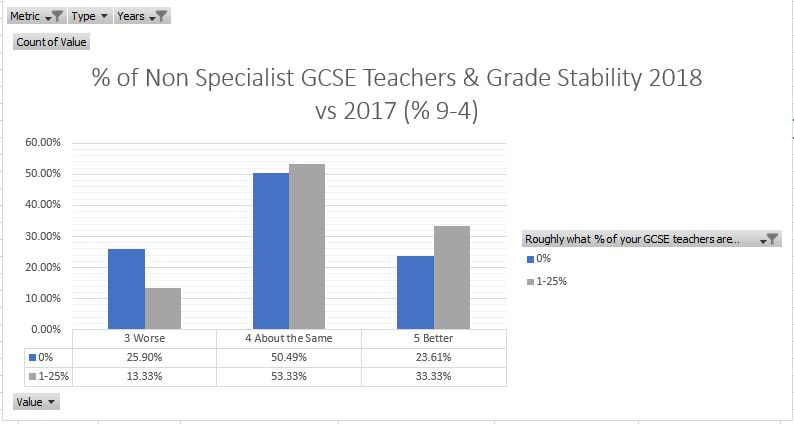
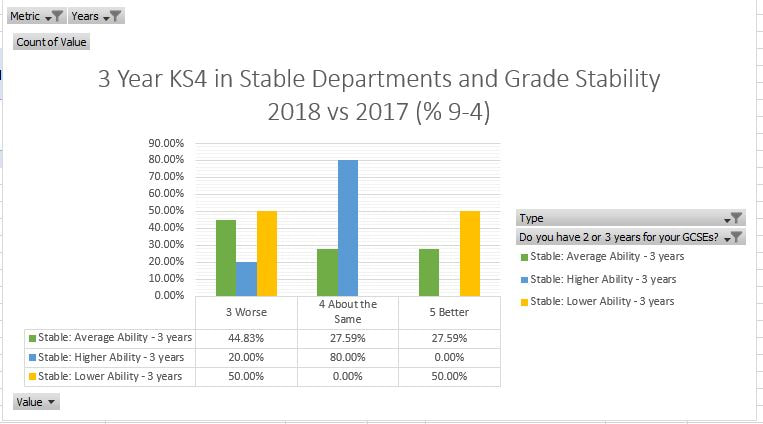
This is one of the most interesting, and runs somewhat counter to what I was expecting. If we look at the correlation between departments with no non-specialists and result stability in 2018, we find that there is a slight disadvantage. There are of course many reasons which could account for this: the department might be very tightly run; the non-specialists may actually have taught for a long time; the specialists might have over-taught recycled content areas from old specs etc.  It is also worth saying that only a handful of departments in the sample had non-specialists teaching at GCSE, and then in small numbers. A single positive result might therefore skew this data a lot.
Picture
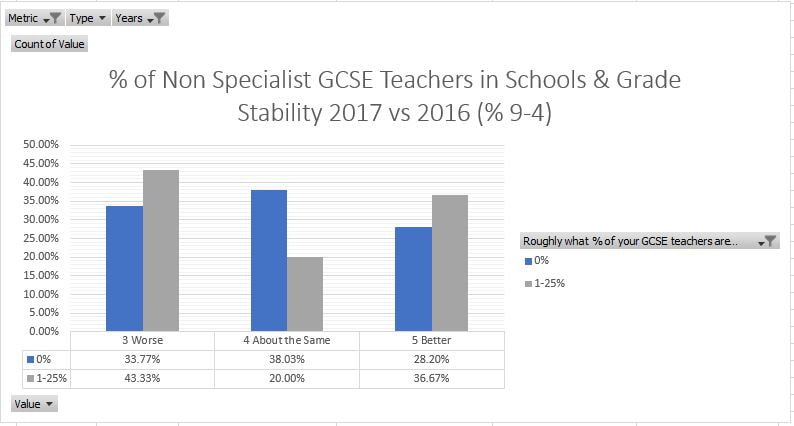
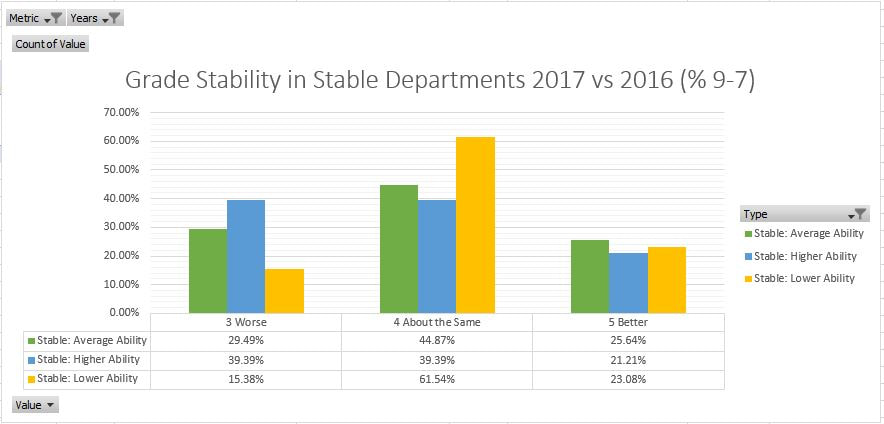
What is most interesting is where this is compared to 2017 vs 2016 grade stability. Here the impact of non-specialists seems to make results much more erratic. This may suggest that the new GCSE has levelled the playing field between specialists and non-specialists somewhat whilst expertise is rebuilt.
Picture
Takeaway: This is hard to call, and I am not sure there are any lessons here. However, there is definitely need for some further investigation into the impact of non-specialist teaching on results. If the specialist teaching does not correlate to better outcomes, that seems like a worrying state of affairs.

Back to main blog
0 Comments

Was the A*-A / 9-7 rate affected?

8/29/2018

0 Comments

 
Back to main blog

4. Was the A*-A / 9-7 rate affected?

In this section I am comparing the percentage of departments where their A*-A / 9-7 pass rate remained stable in 2018 and 2017. This largely follows the pattern set for the 9-4 range. 2018 seems to have been much less variable than 2017.
Picture
​I also cut this down to look at differences between types of school where results were stable across 2016-17.  There was not much of a story to tell here, with average ability departments seeing the most variation at the 9-7 level and lower ability centres the least. 
Picture
​In all cases there was much less variability than seen in 2017.
Picture
Takeaway: Departments do not seem to have suffered unduly in terms of the rate of Grade 9-7 passes when compared to 2017, and in fact the results are slightly more stable than previously.

Next question

Back to main blog
0 Comments

What impact did exam question practise have on results?

8/29/2018

0 Comments

 
Back to main blog

3. What impact did exam question practise have on results?
​Another common question. Did centres who practised exam questions frequently do better in terms of grade stability? Short answer: not really, no. (I have taken the options here which had by far and away the most responses – 90% between them)

Picture
When this was broken down to look at school type, the strongest correlation with improvement for lower attaining schools was to have exam question practise on a half-termly basis. Only practising during the final revision period in these schools however was by far and away the worst option. There was certainly no obvious benefit to weekly or fortnightly practise. Average and higher attaining schools showed almost no pattern when it came to frequency of practise.

Takeaway: Think carefully before bombarding your kids with loads and loads of exam practice questions – they may not really be helping. Sometimes grasping the content well, or doing something which builds confidence can be just as effective. Also, if you are musing over a 3 year KS4, spending the extra time on loads of exam practise does not seem to be a great driver.

Next question

Back to main blog
0 Comments

Did teaching a 2 or 3 year curriculum have the biggest impact on 2018 results?

8/29/2018

0 Comments

 
Back to main blog

2. Did teaching a 2 or 3 year curriculum have the biggest impact on 2018 results?
This is quite a tough one to answer and again, the results need to be taken with a pinch of salt. Here I have compared the basic stability of 2018 results vs 2017 by the number of years spent teaching the course. The result is that a 2 year curriculum seems to have offered more stable results.
Picture
​To see if this was related to school type, I decided to break this down further and look at the impact of 2 or 3 year GCSE based on the STABLE higher, middle and lower brackets identified previously. Interestingly lower ability students seemed to benefit from a 2 year curriculum, with average and higher ability students showing a normal distributions. The 3 year curriculum was much more divisive, showing a negative correlation in average ability schools, a neutral one in higher ability, and a very split picture in lower ability schools. 
Picture
Picture
​When all schools are factored in (stable, rising and falling), the results suggest that in average and higher attaining schools, the 2-year KS4 curriculum offers a slightly more stable outcome. Whereas, in lower ability schools a 3-year KS4 curriculum shows a significantly negative impact (see below).
Picture
​Finally, I thought I would look at which specifications were most likely to be completed. Looking at this data, OCR B seemed to be completed most often and AQA the least, however there were few differences between the boards. 
Picture
​The picture was slightly worse when 2 year KS4 was filtered for. Here the gaps between the big three at 100% and 90% completion were larger. 
Picture
Takeaway: Although there are many reasons why a 3 year KS4 may not have worked well this year, there is a strong correlation between worsening results and the three year KS4 in lower attaining departments. This is definitely something to consider. In other settings, the value of a 3 year KS4 currently seems questionable, though of course these is no way of knowing what impact keeping a 2 year KS4 would have had. If you are sticking with 2 years, you may want to look at your spec options, or how you are spacing out the content.

Next Question

​Back to main blog 
0 Comments

    Key Files

    Archives

    January 2019
    August 2018
    March 2017
    February 2017
    January 2014
    November 2013
    October 2013

    Categories

    All
    Assessment
    Causation
    Change & Continuity
    Communication
    Concepts
    Evidence
    Interpretations
    Northern History Forum
    Ofsted
    Perspectives
    Planning
    Posters
    Progression Model
    Student Materials

    RSS Feed

Powered by Create your own unique website with customizable templates.
Photos used under Creative Commons from j van cise photos, Phil Roeder