Back to main blog
4. Was the A*-A / 9-7 rate affected?
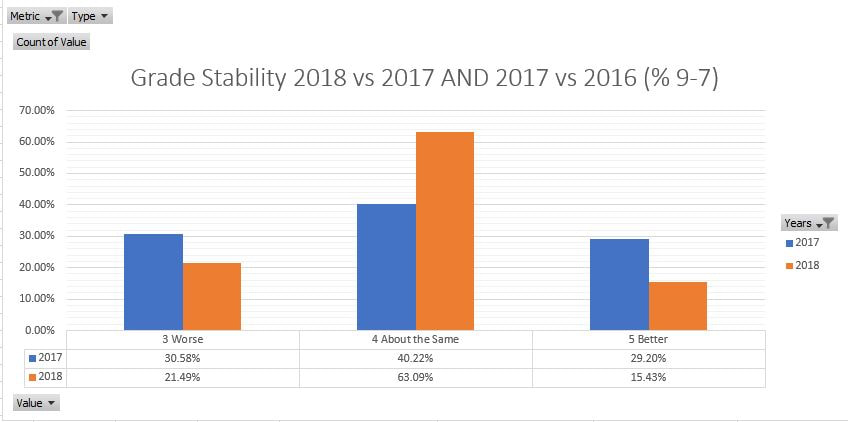
In this section I am comparing the percentage of departments where their A*-A / 9-7 pass rate remained stable in 2018 and 2017. This largely follows the pattern set for the 9-4 range. 2018 seems to have been much less variable than 2017.
4. Was the A*-A / 9-7 rate affected?
In this section I am comparing the percentage of departments where their A*-A / 9-7 pass rate remained stable in 2018 and 2017. This largely follows the pattern set for the 9-4 range. 2018 seems to have been much less variable than 2017.
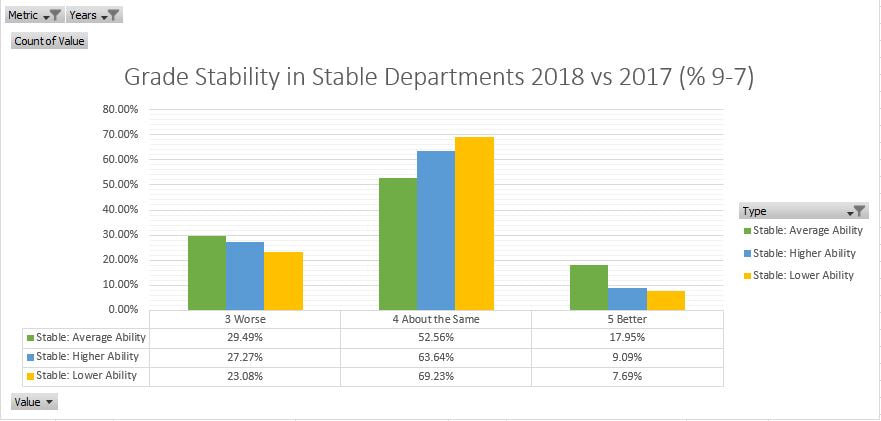
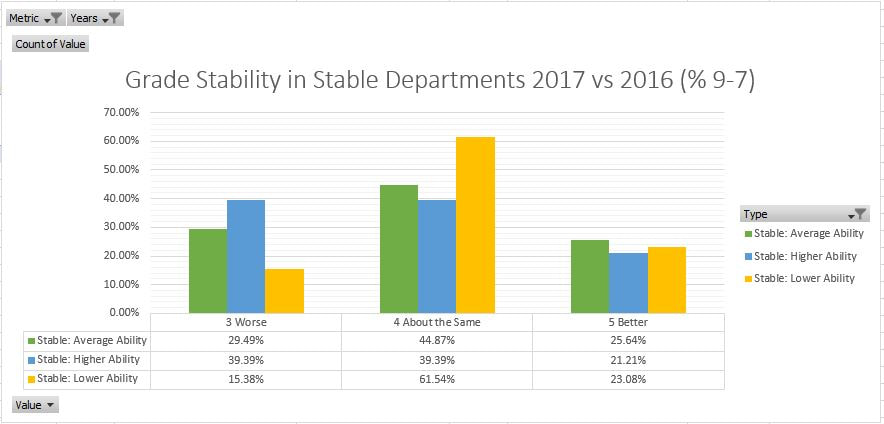
I also cut this down to look at differences between types of school where results were stable across 2016-17. There was not much of a story to tell here, with average ability departments seeing the most variation at the 9-7 level and lower ability centres the least.
In all cases there was much less variability than seen in 2017.
Takeaway: Departments do not seem to have suffered unduly in terms of the rate of Grade 9-7 passes when compared to 2017, and in fact the results are slightly more stable than previously.
Next question
Back to main blog
Next question
Back to main blog


 RSS Feed
