-------
Evening all, I thought I'd take a few minutes to outline five key things we found out about the new History GCSEs. OK, it's really four and a question, but hey ho!
1) Pupils this year did pretty much the same as last year overall
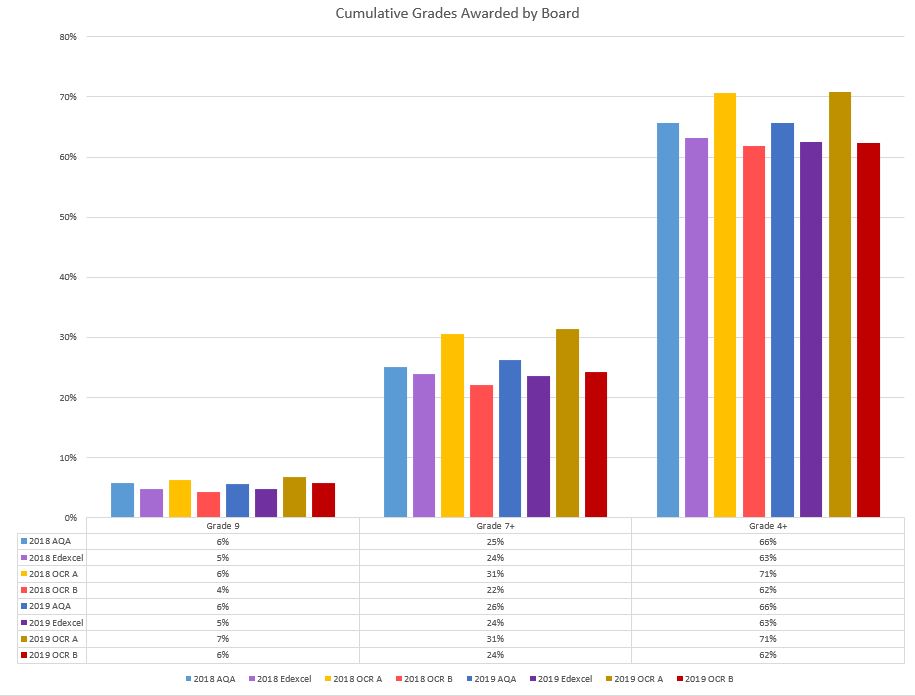
No changes here, and no surprise given the details below. I have updated the chart to show the 2019 results side by side.
This is not really a surprise as Ofqual demanded a statistical tie between 2017 and 2018. Therefore almost the same proportion of kids got a G/1 or greater as last year, and the same for C/4 and A/7.
Of course, this does not mean everyone’s results will have been stable. It is common with new specifications for some schools to do much better than normal and some to do much worse. This is usually because some schools manage to match what examiners were looking for more closely. It is almost impossible to second guess this precisely in the first year of a specification as examiners refine their expectations during first marking and grading discussions.
Takeaway lesson:
NO CHANGES HERE
Read the examiners’ reports closely and get some papers back if you were not happy with your overall results.
2) Your choice of board made almost no difference to overall grades (on average)
There is very little change here this year. The distribution of awards per board seem to be fairly static and this reflects the fact that awards are still tied to pupil prior attainment. From this we can therefore infer that centres doing OCR A tend to have cohorts with higher prior attainment and that therefore a greater proportion of higher grades can be awarded.
Discounting the statement at the end of the last point: because the boards all had to adhere to this basic rule when awarding grades, the differences between boards are also non-existent. If you look at the detail you will see that some boards did deviate from the 2017 figures, however this is because they have to take prior attainment into account. So, the reason that OCR A seem to have awarded more 4+ and 7+ grades would suggest that more high attaining pupils took these exams. By contrast OCR B probably awarded slightly fewer 4+ and 7+ grades due to a weaker cohort. This might imply that OCR centres chose their specification based on the ability range of their pupils (though this is pure speculation). AQA and Edexcel pretty much fit the Ofqual model, suggesting they had a broadly representative sample of pupils.
None really!
3) The papers this year continue to be harder than pre 2018 [updated statement]
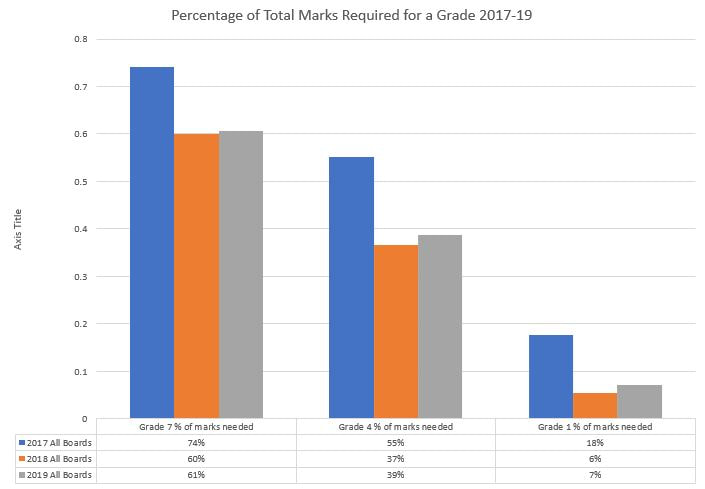
In comparing raw marks required for different grades, there continues to be a big difference between pre 2018 exams and the current crop. Differences between 2018 and 2019 grade boundaries however were fairly minimal. That said, there were some interesting differences which I have outlined in the charts below.
Given that the proportion of students getting grade 1+, 4+ and 7+ were fixed, the moving grade boundaries tell us a little about how difficult/accessible the papers were:
- If the grade boundaries go up it suggests pupils found the paper easier
- If they go down, it suggests the pupils found the paper harder
In the chart below, you can see that in 2017 pupils in history generally needed to get 74% to be awarded a grade A, however in 2018, they needed only 60% of the marks. In 2019 this increased a fraction to 61%. As a rough measure, this suggests the A grade in history was 19% harder/less accessible for pupils in 2018 vs 2017, but "only" 18% harder (!!) in 2019. The big issues are much more evident at Grade C/4 and G/1 where pupils needed just 37% and 6% of the marks on average in 2018 vs. 55% and 18% in 2017. In 2019, the Grade 4 fiure sat at 39% of marks and the Grade 1 at 7% of marks. In essence this makes the 2019 exams 30% harder for pupils to get a Grade 4 than in 2017 (vs 34% harder in 2018) and 60% harder to get a Grade 1 (vs 69% in 2018).
- These were meant to be strengthened GCSEs to raise standards. There were around 18 questions between 2 or 3 papers for most of the GCSE specification. On average, each of these questions was worth around 9 marks. A pupil who gained a G grade probably only got around 10 marks in total over these papers. Or in other words, they answered only 1 complete question correctly in 3 papers and over 4 hours of exams. By contrast a pupil in 2017 was getting around 36 marks across their papers, and therefore answering at least 3 whole questions correctly. This does not change substantially in 2019.
- We cannot be sure why pupils scored so badly at the lower end, by the fact that marks are so low at Grade 1 boundary (and even Grade 4) suggests that many pupils failed to finish papers, or possibly failed to complete whole papers. For anyone who has worked with pupils who lack confidence, non-finishing and being put off by difficult questions can be a killer in terms of examination success. At the very least, pupils in 2017 were given a chance to demonstrate their knowledge more completely than in 2018. The very low marks at the bottom end also make the issue of fair grading a bit of a crap shoot. It would have been possible for a child to get lucky on a single question (something they had just looked at) and secure a grade 1 without answering a single other question on the paper. Meanwhile a child with weak knowledge and limited confidence might have attempted 3 or 4 questions with a little success and then given up and received the same grade. Again, no real change here, except at board level.
Takeaway lesson:
NO CHANGES
Your top end pupils are probably fine with all the changes, but your weaker students are going to struggle. Strategies to finish papers, or answer more questions will be key, alongside boosting core knowledge and building confidence in the face of hard questions.
4) Some boards were harder/less accessible than others
I have added some further 2019 analysis to this section
Following on from the above, a closer analysis of the grade boundaries reveals some interesting things. Again, we take the premise that the grades were fixed and therefore lower grade boundaries essentially mean a harder set of papers.
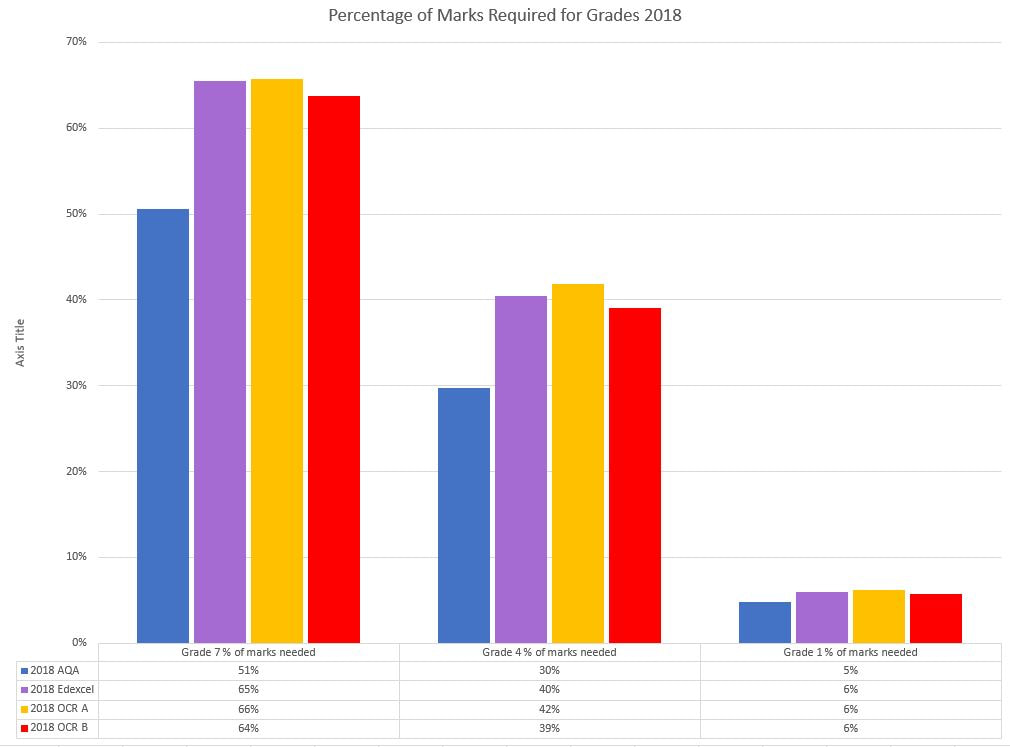
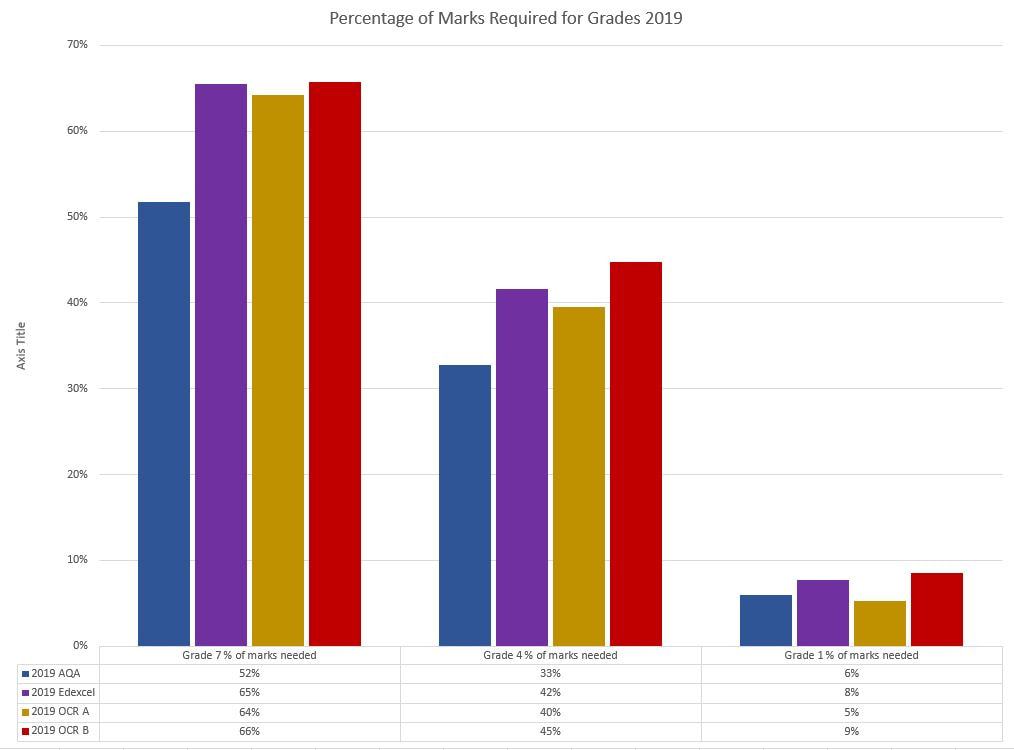
If we look at the charts below we can see that the percentage of marks required for a Grade 7+, 4+ and 1+ were broadly similar across Edexcel and OCR. However, the AQA grade boundaries for both grades 4+ and 7+ are significantly lower in both 2018 and 2019. At grade 7 the difference is 15% and at grade 4 it is around 10%. This would suggest that pupils found the AQA papers noticeably harder/less accessible than pupils taking the other boards despite the additional time offered by AQA in an exam revision for the 2019 series.
The year on year changes are also quite interesting. Looking at the percentage of marks required for different grades and comparing these, it is possible to look at whether papers have become harder or easier year on year. The picture here suggests little change at Grade 7+. However, at Grade 4+ analysis suggests that pupils studying AQA in 2019 found the papers slight more accessible at Grade 7+ (2% change), and Grade 4+ (9% change). OCR B saw a larger shift at Grade 7+ (3% more accessible) and Grade 4+ (13% more accessible). Edexcel meanwhile saw very little change at Grades 4+ and 7+ in terms of accessibility, while OCR A papers actually became slightly harder to access for pupils. All boards, apart from OCR A were apparently more accessible for the weakest, with shifts from 20% (AQA) to 33% (OCR B) in the positive direction. This means that pupils gaining a Grade 1 in 2019 required 5% of the marks for AQA and 9% of the marks for OCR B. This compares to an average of 18-19% in 2017, so accessiblity is still a major issue for the weakest students!
Takeaway lesson:
If you are doing AQA and you have a very mixed cohort, or a large number of 3-4 borderline students, this may well not be the right specification for you. Have a think about some of the key points on spec switching. That said, AQA have done a little to address the issues, but not enough to close the gap in 2019. OCR B seem to be offering the most accessible papers in terms of pupils being able to answer the questions set, though this may vary between options and all papers are nowhere near as accessible as in 2017.
5) Should I change exam boards?
No major changes here, but I have included a comparison of board sign up below. It would seem very few people changed in the 2018-19 year, though this was to be expected given that the first set of reuslts had not been published when the current cohort began their studies. It also means that OCR's decline in terms of market share remains pronounced.
Below is a list of possible reasons for your exam results being poorer than in previous years.
- Your students might not have approached the exam in the way the examiners intended for any number of reasons.
- Read the examiner reports closely and request a range of papers. If you can’t afford your own papers, ask the board to send you some scripts from across the range. Keep asking the boards for advice. It never hurts to have at least one department member marking either!
- Your students might not have answered enough questions, or failed to finish papers, as seems to have been common this year.
- Work on timing and confidence building. Some more realistic grade boundaries will probably help here, but bear in mind these will probably go up next year as people get used to the exam.
- You did not cover the course completely.
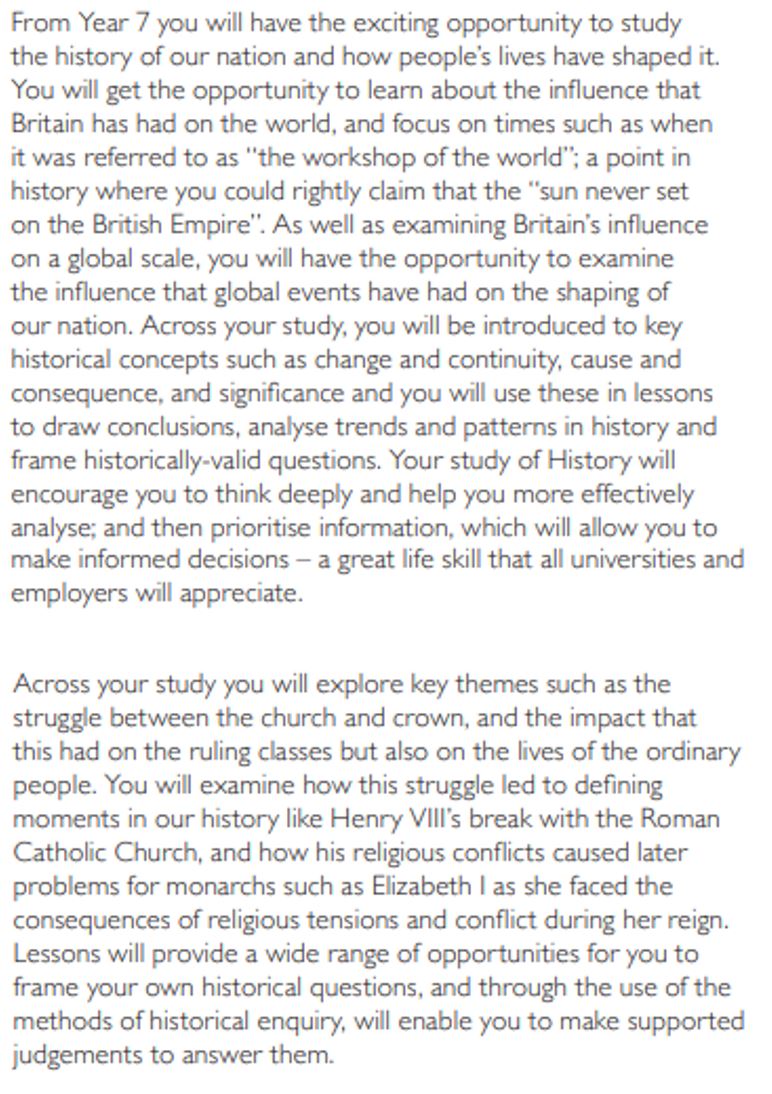
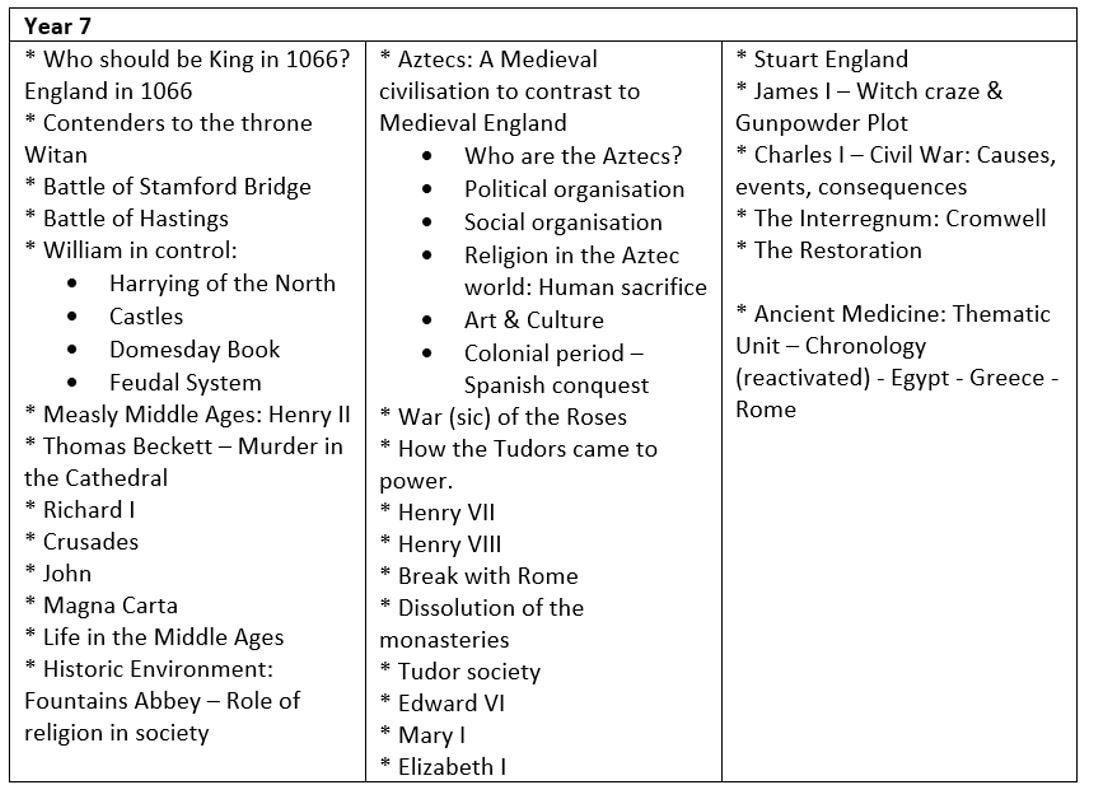
- Rethink your planning in light of the depth of understanding required by the exam. One big issue I have seen a lot is departments taking legacy units and spending too long on things which are now less important in the new specs e.g. ancient medicine. You might also like to consider how conceptual understanding might be supported by a re-worked Key Stage 3, both in terms of knowledge and second order concepts. Hodder are about to publish a new KS3 book to this end. You might also like to read Rich Kennett and my recent article in Teaching History 171 via https://www.history.org.uk/publications/categories/300/resource/9398/teaching-history-171-knowledge
- Any number of departmental, school, other issues
- This happens all the time. If you have been in turmoil, a change of exam board is not always wise. A bit of stability often goes a long, long way in a troubled department or school! Seek out help from schools doing the same spec nearby. Get on any exam board, or other training ASAP. If you are OCR B, don’t forget regional advisors.
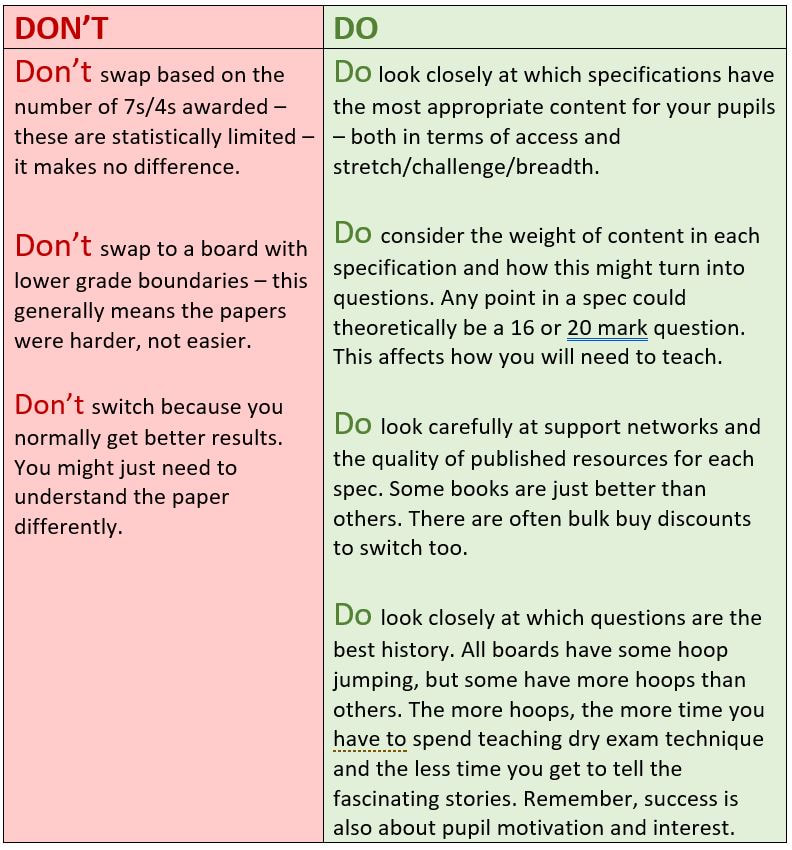
If you are still considering changing boards, bear the following points in mind:

 RSS Feed
