
I'm afraid today's blog, a bit like yesterday's is a bit of a rant. More to the point, it is a response to yet another partially researched claim, namely that Grammar Schools (Schools for Everyone TM?) are more effective than their comprehensive counterparts. Indeed, the Telegraph ran an article a few days ago stating that this was a ringing endorsement for May's flagship education policy. Here I wanted to unpick some of the claims being made about Grammar Schools, and ask that we take a moment to be cautious before endorsing a systemic change based on limited evidence. I am fairly sure I have my calculations right here, however please let me know if you think I have made a mistake.
The Progress 8 Issue
The claim that Grammar Schools outperform state Comprehensives does have some basis in evidence. This can be seen in the latest GCSE statistics published by the DfE. The Telegraph explains that...
The Progress 8 Issue
The claim that Grammar Schools outperform state Comprehensives does have some basis in evidence. This can be seen in the latest GCSE statistics published by the DfE. The Telegraph explains that...
Under the new Progress 8 measure, the national average for progress is 0 for mainstream schools. Today’s figures show that the average Progress 8 score for all grammar school pupils is 0.33, compared with -0.01 for comprehensive schools.
Here they imply that the Grammar School score of 0.33 shows that Grammars significantly outperform Comprehensives. On the surface this is true, on average, Grammar Schools did outperform state Comprehensives. However there are a number of very good reasons to be cautious here.
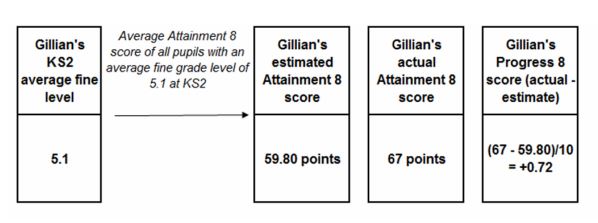
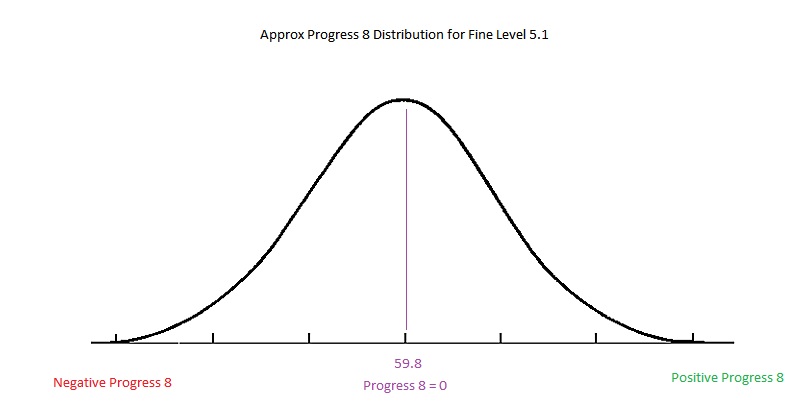
Before I go any further, I think it would be worth explaining a little more about Progress 8. Essentially the measure aims to see how far pupils have progressed between Key Stage 2 and Key Stage 4. Each pupil is ranked by their KS2 attainment using a "fine level"; which might be 4.2, or 5.6 for instance. In the example from the DfE below, Gillian has a KS2 fine level of 5.1. Once GCSEs have been taken and marked, the mean average Attainment 8 score of all pupils with a fine level of 5.1 is found (in this case 59.8). This number will change every year depending how children perform. The mean average now becomes the benchmark against which all pupils are measured. Their score against this mean average is their Progress 8 score. In Gillian's case, she scored significantly above the average for pupils with a fine level of 5.1, so her Progress 8 score is +0.72. This means she scored nearly 3/4 of a grade better than other children with a 5.1 fine level at KS2 nationally. A child who scored -0.5 would have made half a grade less progress than children with the same fine level as a staring point. Effectively children are norm referenced by their KS2 fine level and are in direct competition with other children on the same fine level starting point - not everybody can succeed! In fact, the average Progress 8 for each fine level should come out around 0, forming a lovely bell curve.
Before I go any further, I think it would be worth explaining a little more about Progress 8. Essentially the measure aims to see how far pupils have progressed between Key Stage 2 and Key Stage 4. Each pupil is ranked by their KS2 attainment using a "fine level"; which might be 4.2, or 5.6 for instance. In the example from the DfE below, Gillian has a KS2 fine level of 5.1. Once GCSEs have been taken and marked, the mean average Attainment 8 score of all pupils with a fine level of 5.1 is found (in this case 59.8). This number will change every year depending how children perform. The mean average now becomes the benchmark against which all pupils are measured. Their score against this mean average is their Progress 8 score. In Gillian's case, she scored significantly above the average for pupils with a fine level of 5.1, so her Progress 8 score is +0.72. This means she scored nearly 3/4 of a grade better than other children with a 5.1 fine level at KS2 nationally. A child who scored -0.5 would have made half a grade less progress than children with the same fine level as a staring point. Effectively children are norm referenced by their KS2 fine level and are in direct competition with other children on the same fine level starting point - not everybody can succeed! In fact, the average Progress 8 for each fine level should come out around 0, forming a lovely bell curve.
A school's Progress 8 score is calculated by adding all the individual students' Progress 8 scores together and dividing by the number of students. Nationally speaking, Progress 8 for all state schools comes out at zero due to this norm referenced approach.
Are Grammars Performing Better?
With all this taken into account, Grammar Schools scoring 0.33 does appear to show that they are more effective than state Comprehensives when moving students from their starting points. Certainly it means that there are Comprehensives in which higher ability children are under performing on average compared to Grammars. However, the following should be taken into account:
- Because Comprehensive Schools account for 91% of all the schools compared by the government, and the system is norm referenced, it is entirely natural that they should come out with a Progress 8 score on or around 0. This is because the whole system is set to default to 0. The 163 Grammar Schools represent a tiny sample of this much larger set. The fact they score 0.33 suggests they are having an impact, but comparing this to Comprehensives is almost meaningless using Progress 8 as the measure. Education DataLab go into more detail on why Grammars have things weighted in their favour HERE
- Grammar Schools take substantially fewer children who have free school meals status. The Sutton Trust found that 66% of children with Level 5 in English and Maths went to Grammars in selective areas compared to 40% of similarly high achieving pupils with FSM. As FSM has a known impact on outcomes, this may go some way to explaining part of the success of Grammars.
- Grammar School coaching is a thriving industry. The fact that many students who attend Grammar Schools have already shown an aptitude for testing and are likely to have been supported by parents in passing their entrance exam also suggests some possible impact. Parents who spend money to coach their children for the 11+ may also spend money on tuition for GCSE examinations. More research needs to be done into this, but it is certainly a salient issue.
- I would contend that Grammar Schools are more likely to enter their students for Ebacc subjects. This is vital as without a suite of Ebacc subjects, many students effectively throw away 3 qualifications which could count towards their overall grades. Pupils in a Comprehensive which allows free choice of subjects are therefore likely to score lower than those in schools which force Ebacc choices. This puts the first group of students at a significant disadvantage when comparing Progress 8 scores.
- Grammar Schools are not directly comparable to the outcomes for other Comprehensives as they do not cater for the same range of pupils - there is much hidden in the numbers (more on this later).
- High achieving Comprehensives are weighed out by low achieving ones. There are many factors which might make a school low achieving which are not captured in this debate.
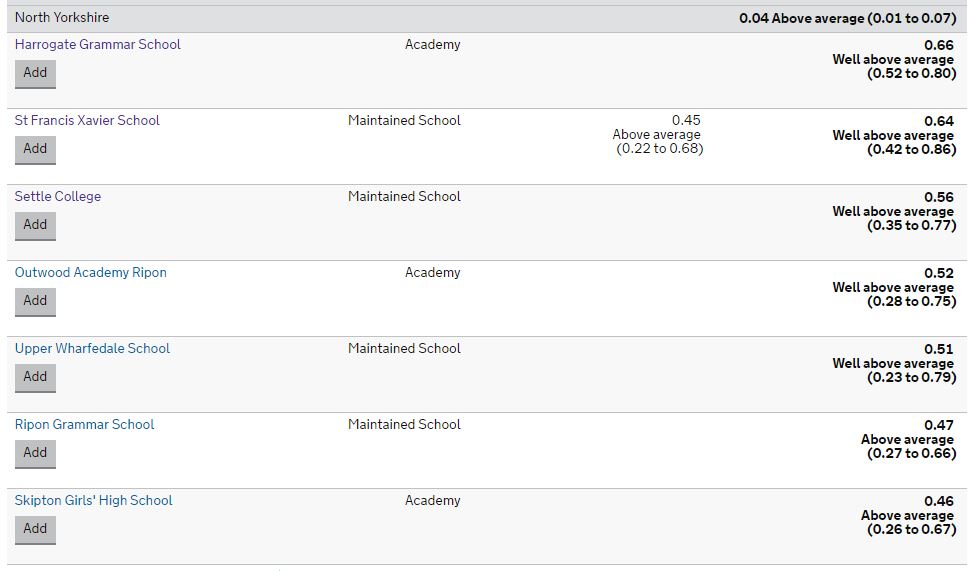
- When I compared local Grammar Schools to Comprehensives with high SES and high ability intakes, the differences were much less clear cut. In the example below you can see that the highest performing school in North Yorkshire is Harrogate Grammar (a Comprehensive), which fits the high prior attainment and high SES profile discussed. Another 4 schools come before the first Grammars: Ripon and Skipton Girls'. Ermysted's Grammar gets a P8 of just 0.9 - notably it enters only 46% of its students for Ebacc compared to Harrogate Grammar's 73%, potentially illustrating the Ebacc effect.
Profile is everything
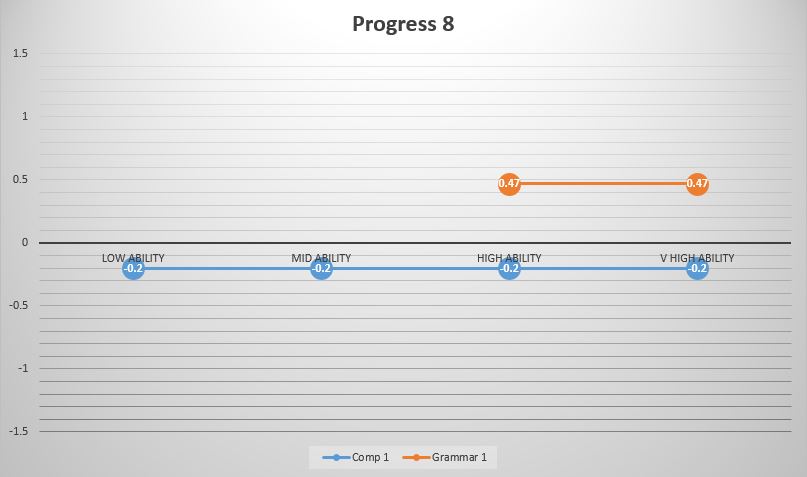
Now here is the really big issue with Progress 8. It boils everything about a school down to a single measure. Ripon Grammar might for example argue that it is doing better than Selby High (P8 -0.2) and this is true on average, but the important comparison would be a profile one. Because the two schools have very different intakes, it is impossible to directly compare their effectiveness at teaching high end students. A simplistic view suggests that this is what is happening. The chart below shows the view portrayed by the Progress 8 figure. It suggests that students of all abilities are scoring the same in terms of P8 (see below).
Now here is the really big issue with Progress 8. It boils everything about a school down to a single measure. Ripon Grammar might for example argue that it is doing better than Selby High (P8 -0.2) and this is true on average, but the important comparison would be a profile one. Because the two schools have very different intakes, it is impossible to directly compare their effectiveness at teaching high end students. A simplistic view suggests that this is what is happening. The chart below shows the view portrayed by the Progress 8 figure. It suggests that students of all abilities are scoring the same in terms of P8 (see below).
If this were the case, then the Grammar School really would be outperforming the Comp on comparable measures. However, the profiles to get these results might look very different. Take the example below.
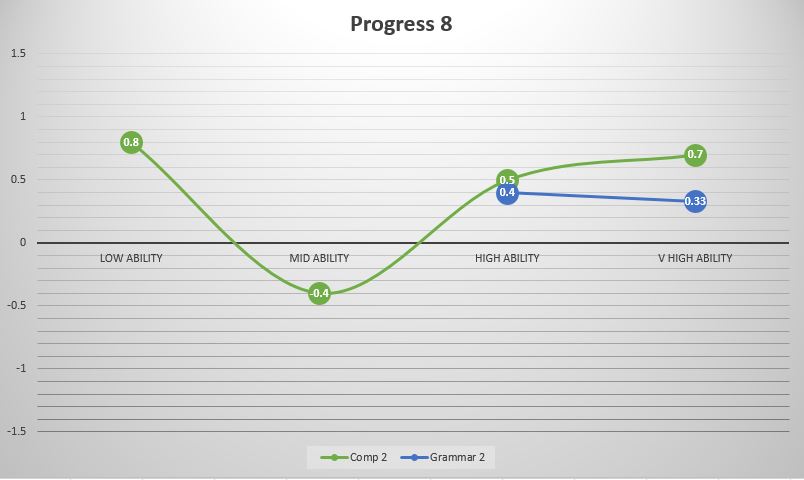
In this example, Grammar 2 averages out with a P8 of around +0.38 (having some high ability students and a good deal of v high). Comp 2 however has chosen not to push for Ebacc choices and has therefore under performed with its middle ability students (the bulk of the school). Despite the fact they have done very well with their weakest and exceptionally well with their higher ability students, these are outweighed by the significant proportion of middle ability students. As a result, such a school might score -0.2 on their Progress 8, despite doing a better job of teaching the higher end than the Grammar.
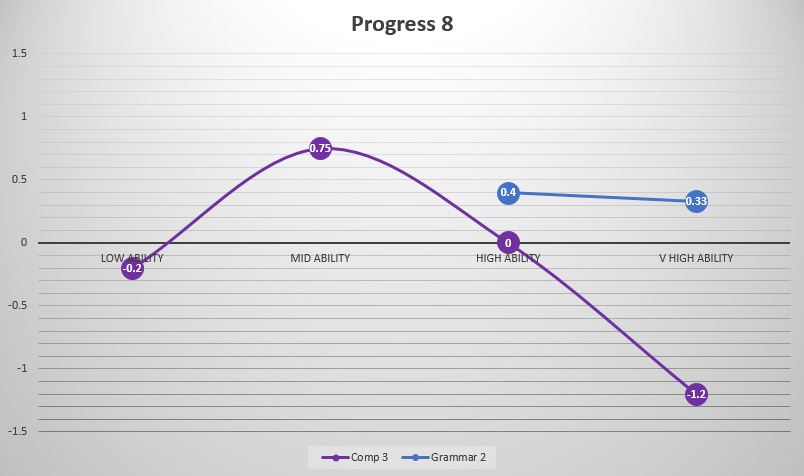
By the same token, a Comprehensive might boost its middle ability students at the expense of its top end, and yet appear to be very effective overall. Here is an imaginary comparison of Grammar 2 above (0.38 average) with an imaginary school scoring +0.67 (and thereby appearing better on paper) thanks to its work with middle ability students who form the bulk of its intake. As you can see, the profile is everything!
By the same token, a Comprehensive might boost its middle ability students at the expense of its top end, and yet appear to be very effective overall. Here is an imaginary comparison of Grammar 2 above (0.38 average) with an imaginary school scoring +0.67 (and thereby appearing better on paper) thanks to its work with middle ability students who form the bulk of its intake. As you can see, the profile is everything!
So there we have it. I could go on at length here on what kinds of things schools might do to get a more favorable Progress 8 outcome, but I shall leave it there. I just ask that we think carefully before using a low-resolution Progress 8 statistic to prove any kind of educational point.
 RSS Feed
